It has been quite a while since I have posted anything on the site. Two babies in two years will rearrange your priorities a bit! However, I am in the middle of a year off from the classroom and have fixed our old house up enough to actually have a bit of time to write about using technology in the classroom again. I am hoping that this will be able to be a bit of a series about using data in the classroom. To kick it off I'm simply sharing a great resource for accessing statistics about Europe and Central Asia. The TransMonEE dashboard will allow you to access data about the status of children and women from various countries and will provide the statistics in an easy to access dashboard.
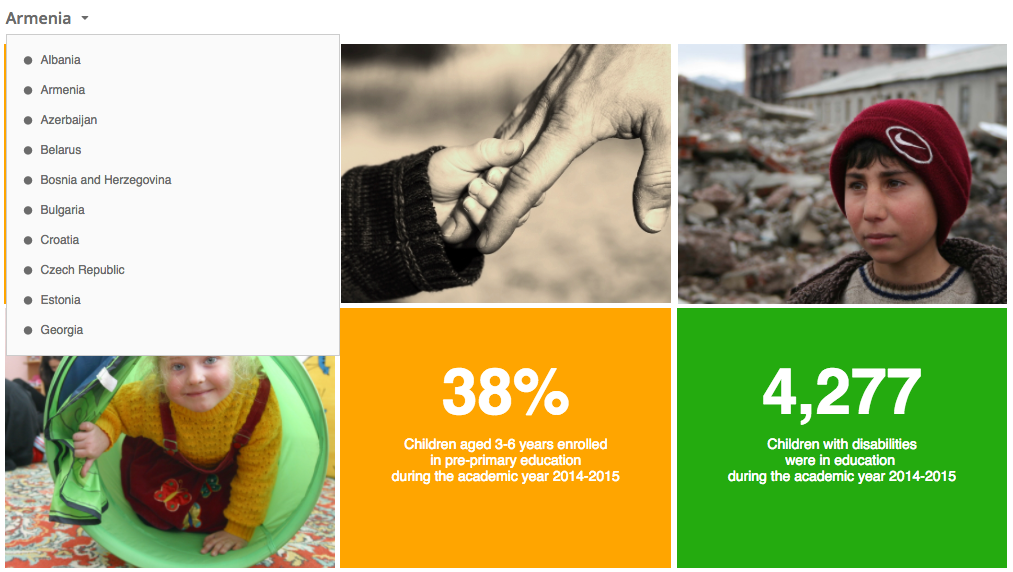
screenshot of Transmonee dashboard
This can be a great way to either access data for processing or as an introduction to various social issues. If you want the raw data you can access their database as well. In the future I am hoping to design a more robust unit for middle school humanities, but for now, here are some ideas on how you might be able to integrate this into your classroom.
Thats just a few ideas for now. If you end up using the dashboard, I would love to hear how you used it in the comments below!
- Math: use statistics for processing and graphing. Anytime you can use real world data it is a more meaningful learning opportunity.
- Science: access population statistics for natality and mortality; access health statistics for a unit related to health or disease.
- Humanities: use data about access to various services such as health or education and how they relate to the SGD's (Sustainable Development Goals).
- Arts: have students access the dashboard and explore to find an issue and country that resonates with them and then create a piece that raises funds or awareness for the issue.
Thats just a few ideas for now. If you end up using the dashboard, I would love to hear how you used it in the comments below!

 RSS Feed
