This may be one of the coolest pieces of educational tech I've seen ever, and it's currently free to use! Desmos is basically a piece of graphing software that allows you to interactively change the variables with a slider and in real time see the changes. I particularly love the "play" feature which will automate the slider movement between the preset minimum and maximum values. They also have tons of examples to get you started.
Below is a sample graph about waves I made in about 5 minutes for a Grade 8 Science inquiry into wave properties. I was able to add some text questions on the side with the sliders. The equation was from an example and I simply changed a few of the variables so that amplitude was (a) and period was (p). Now students can explore the way the ways change before I ever tell them anything about how amplitude and period are defined. My guess is that 5 minutes of prep, and 5 minutes of playing around with students will result in far greater conceptual understanding than I could achieve with them in 2-3 periods of manual graphing, reading, and discussion. Personally I'd have the metal slinkies out next for them to replicate and explain the phenomenon next!
Below is a sample graph about waves I made in about 5 minutes for a Grade 8 Science inquiry into wave properties. I was able to add some text questions on the side with the sliders. The equation was from an example and I simply changed a few of the variables so that amplitude was (a) and period was (p). Now students can explore the way the ways change before I ever tell them anything about how amplitude and period are defined. My guess is that 5 minutes of prep, and 5 minutes of playing around with students will result in far greater conceptual understanding than I could achieve with them in 2-3 periods of manual graphing, reading, and discussion. Personally I'd have the metal slinkies out next for them to replicate and explain the phenomenon next!
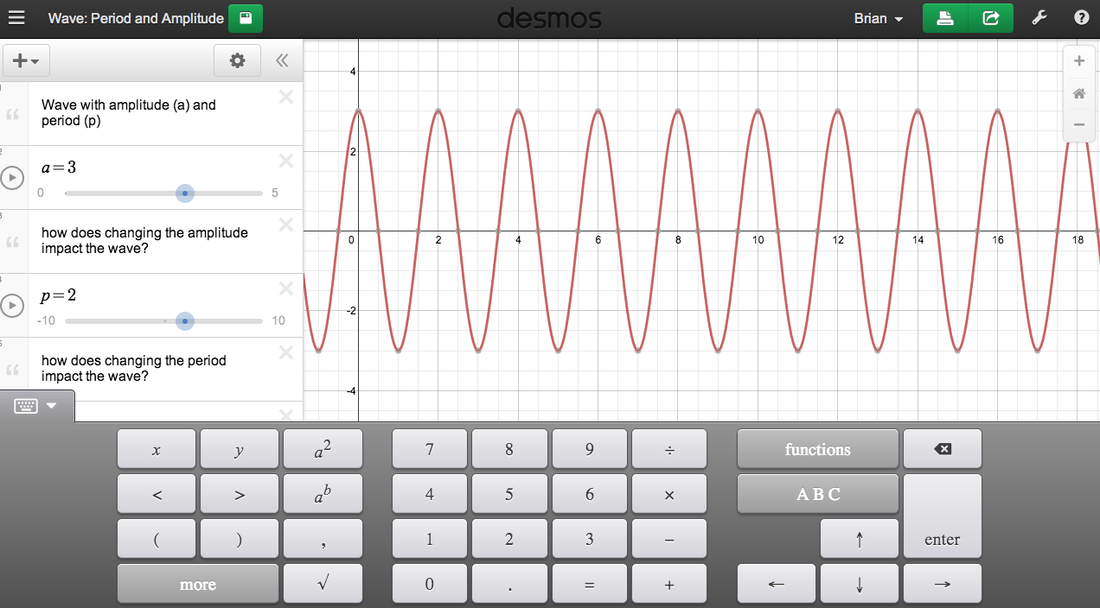
Clink on the image to go to the interactive graph
The customization of the equations is pretty staggering. Note the equation editing options in the image above, which work great on the iPad by the way.
Desmos is pretty amazing even if you never tweak a thing, but just use their provided templates. You have to make sure to click the drop down menu in the very top right (3 lines right above the + symbol). In the example below I would have students play around with the sliders before I ever defined y, m, and b and instead let the students inquire into them, and then use a follow up discussion to clarify any misconceptions.
Desmos is pretty amazing even if you never tweak a thing, but just use their provided templates. You have to make sure to click the drop down menu in the very top right (3 lines right above the + symbol). In the example below I would have students play around with the sliders before I ever defined y, m, and b and instead let the students inquire into them, and then use a follow up discussion to clarify any misconceptions.
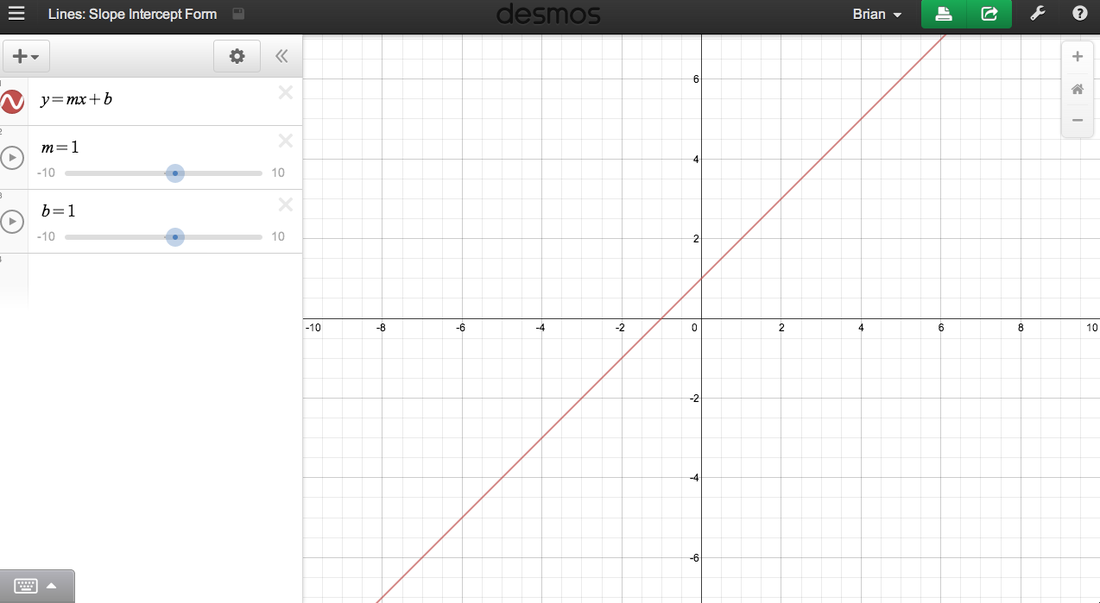
Clink on the image to go to the interactive graph
Another great inquiry I think would be into lines of best fit. Inspired by a lesson from my fantastic maths colleague Melissa, I quickly found some information on speed of sound vs air temp and entered the points into a table. Then I had to decide which type of line I should insert (linear, quadratic, exponential, etc). I added a line of y=mx +b and then tweak the min/max values of the sliders to match the data and then started sliding to see if I could find a formula for the line of best fit. I came up with y=0.599x + 334. When I checked the real value I found that it was y=0.6x + 331.4. That is pretty awesome considering I took 7 data points and in 5 minutes was pretty awesomely close. I was able to predict that at 1000 C the speed would be 992.9 m/s. When checked against published data it was found to be 941.4 m/s. That means I was off by about 5%. Not good enough for NASA, but good enough for a 5 minute inquiry (thanks again Melissa for that great analogy).
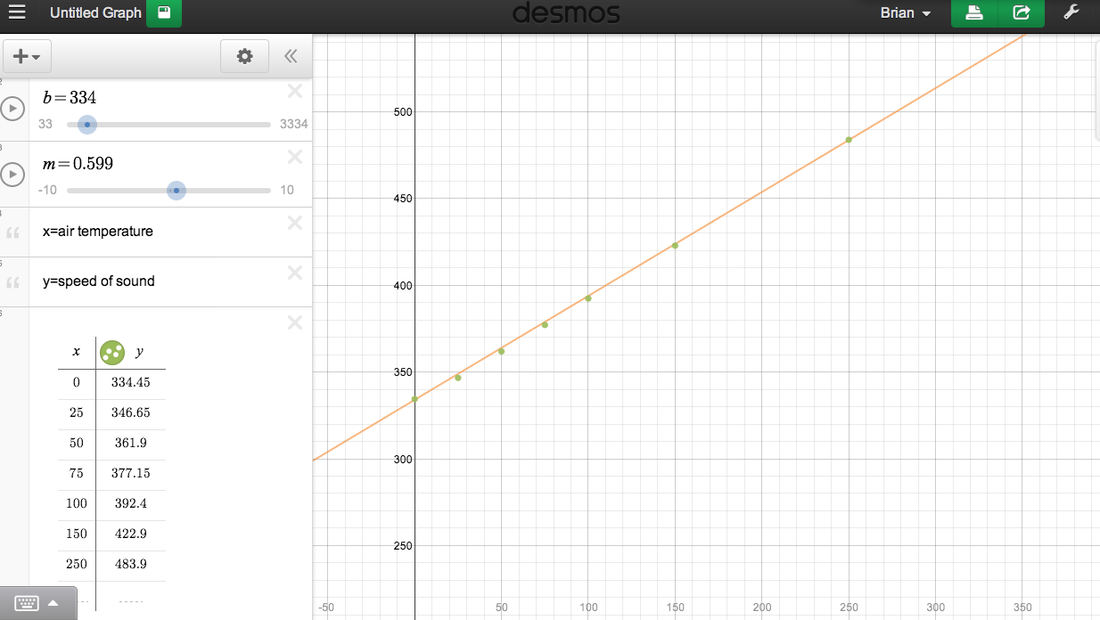
Click on the image to go to the interactive graph
To check out more awesomeness with Desmos, check out:
The Common Ratio: http://thecommonratio.blogspot.com/2013/10/des-man-vodcasts.html where Ange lays out an awesome inquiry with her Grade 11s using DesMan inspire by....
Finding Ways to Nguyen Students Over: http://fawnnguyen.com/2013/03/20/des-man.aspx, and on to the tool...
DesMan Teacher Edition: https://class.desmos.com/desman

 RSS Feed
